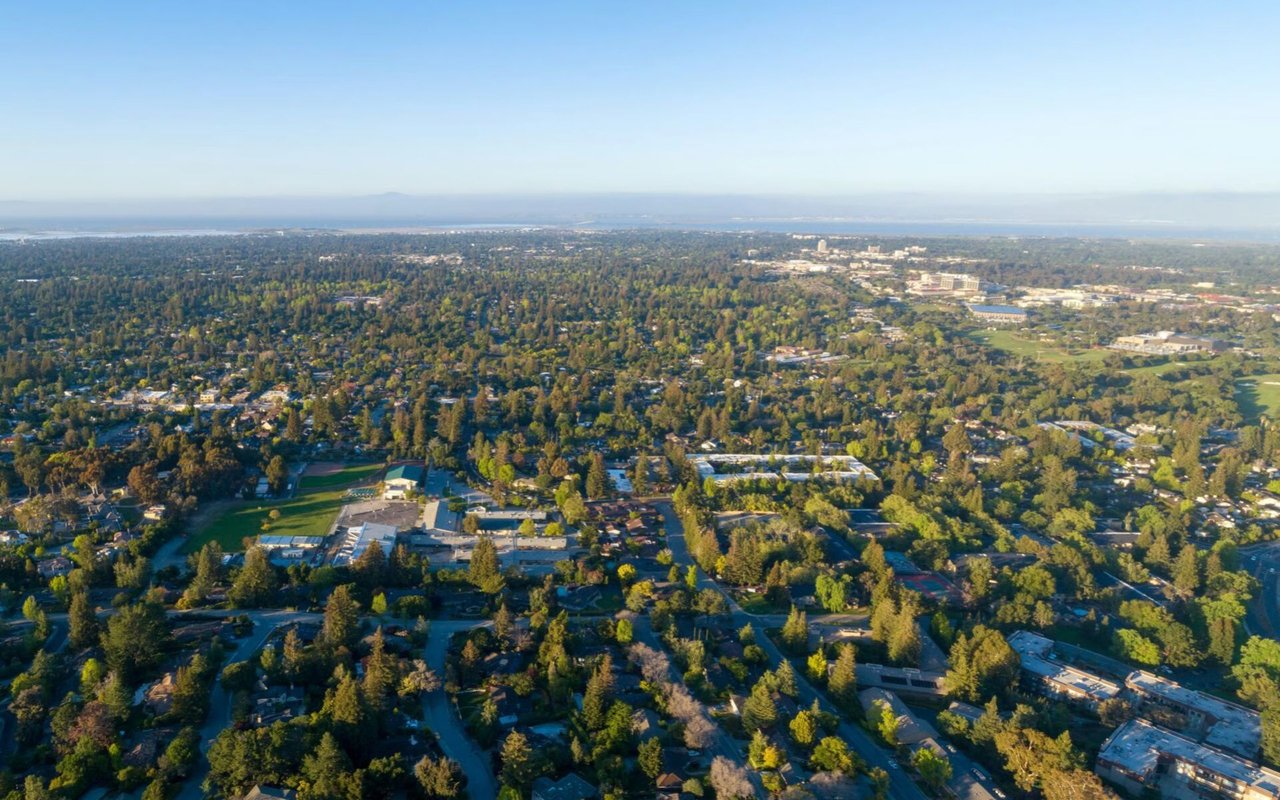
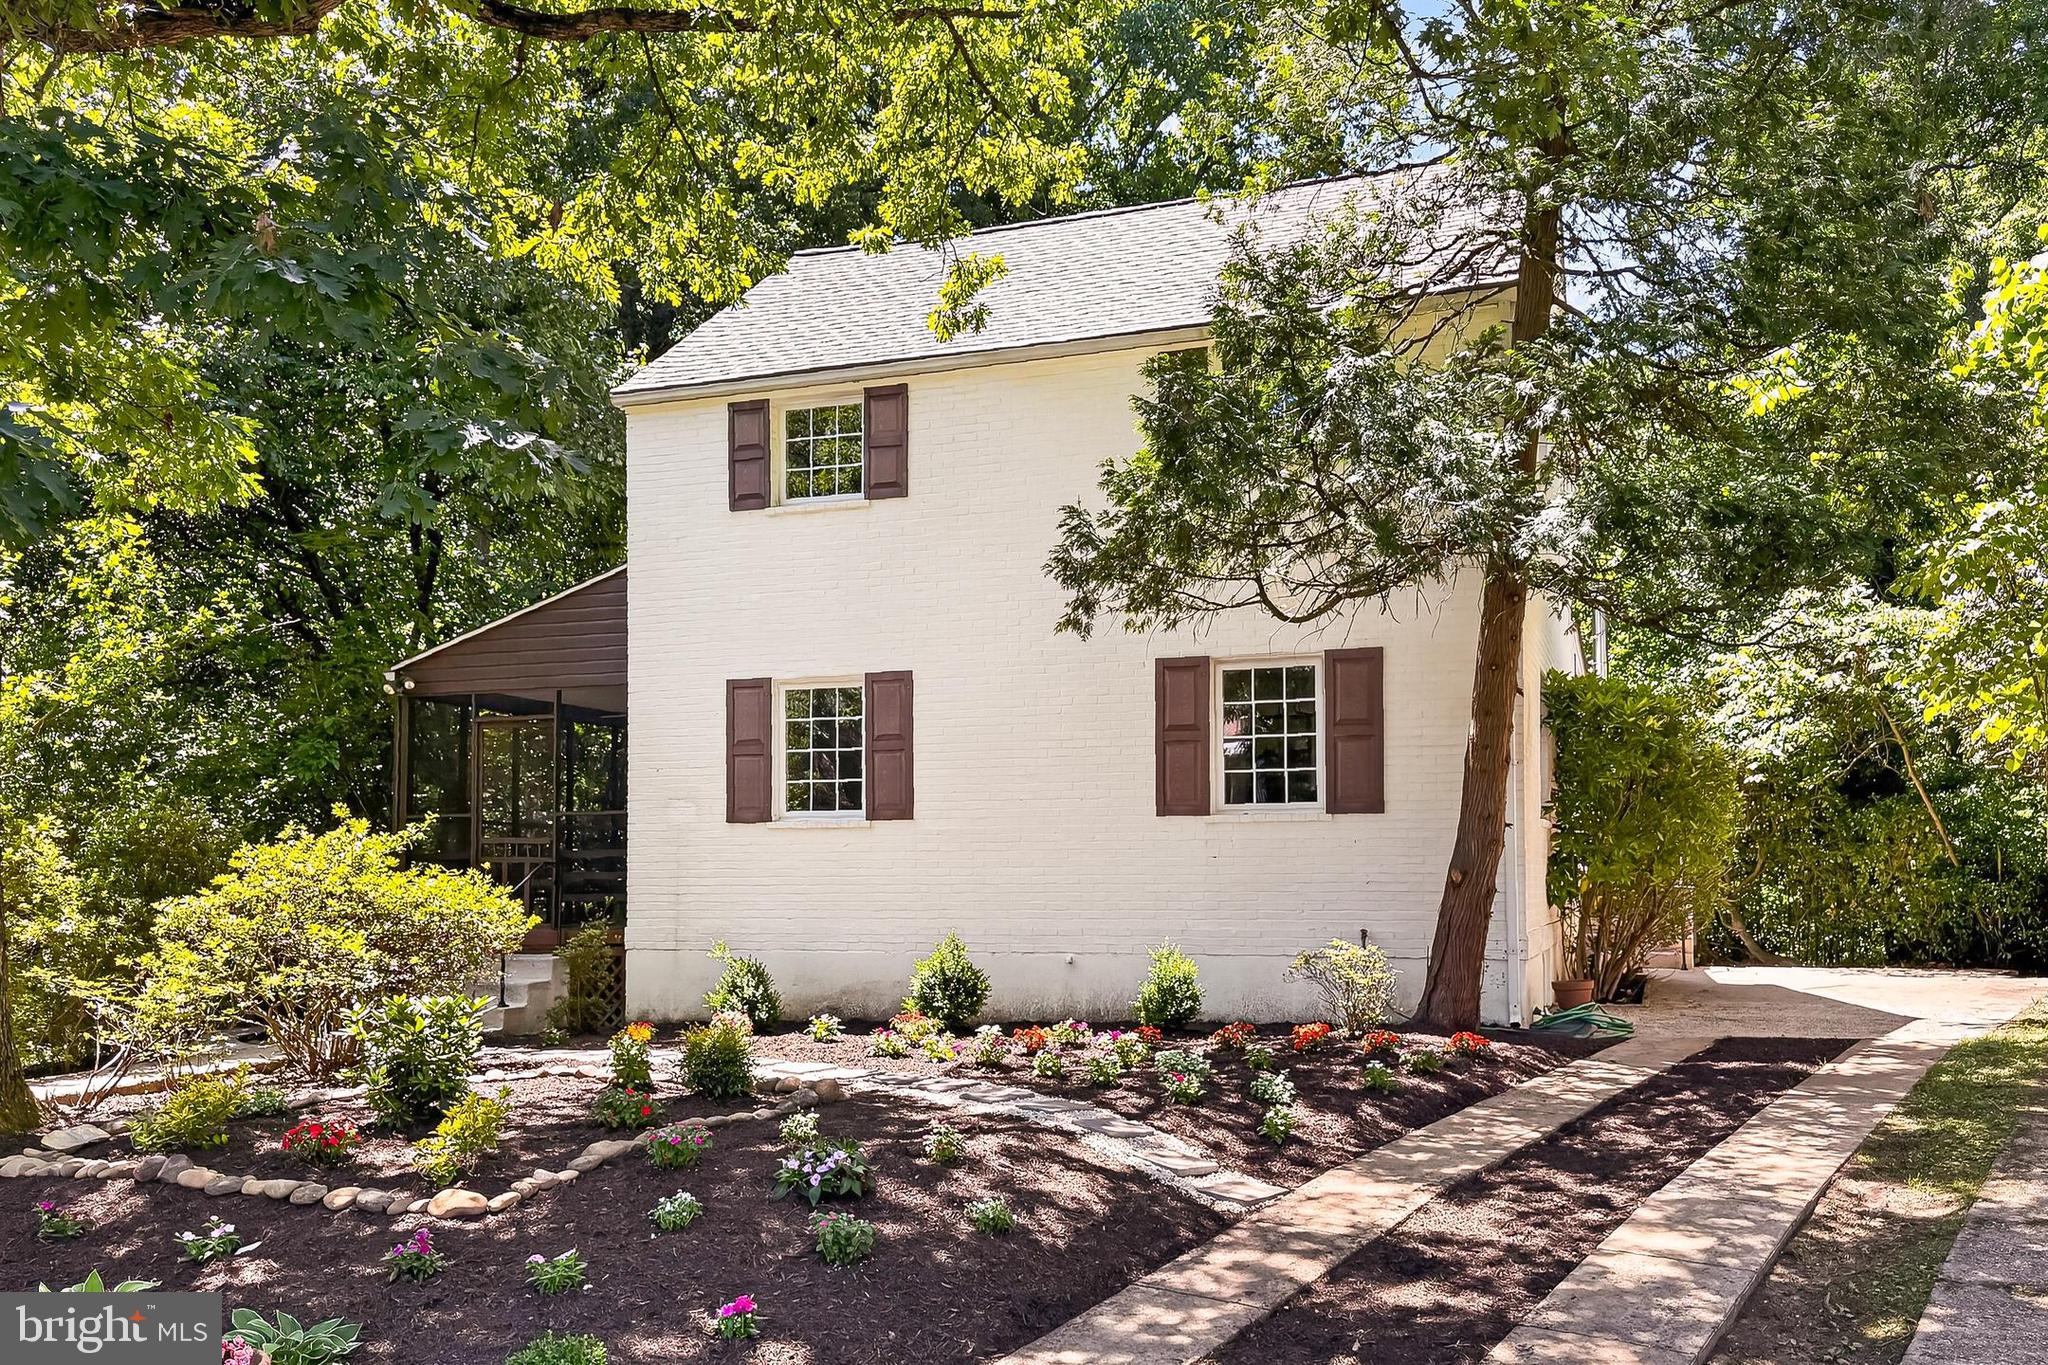
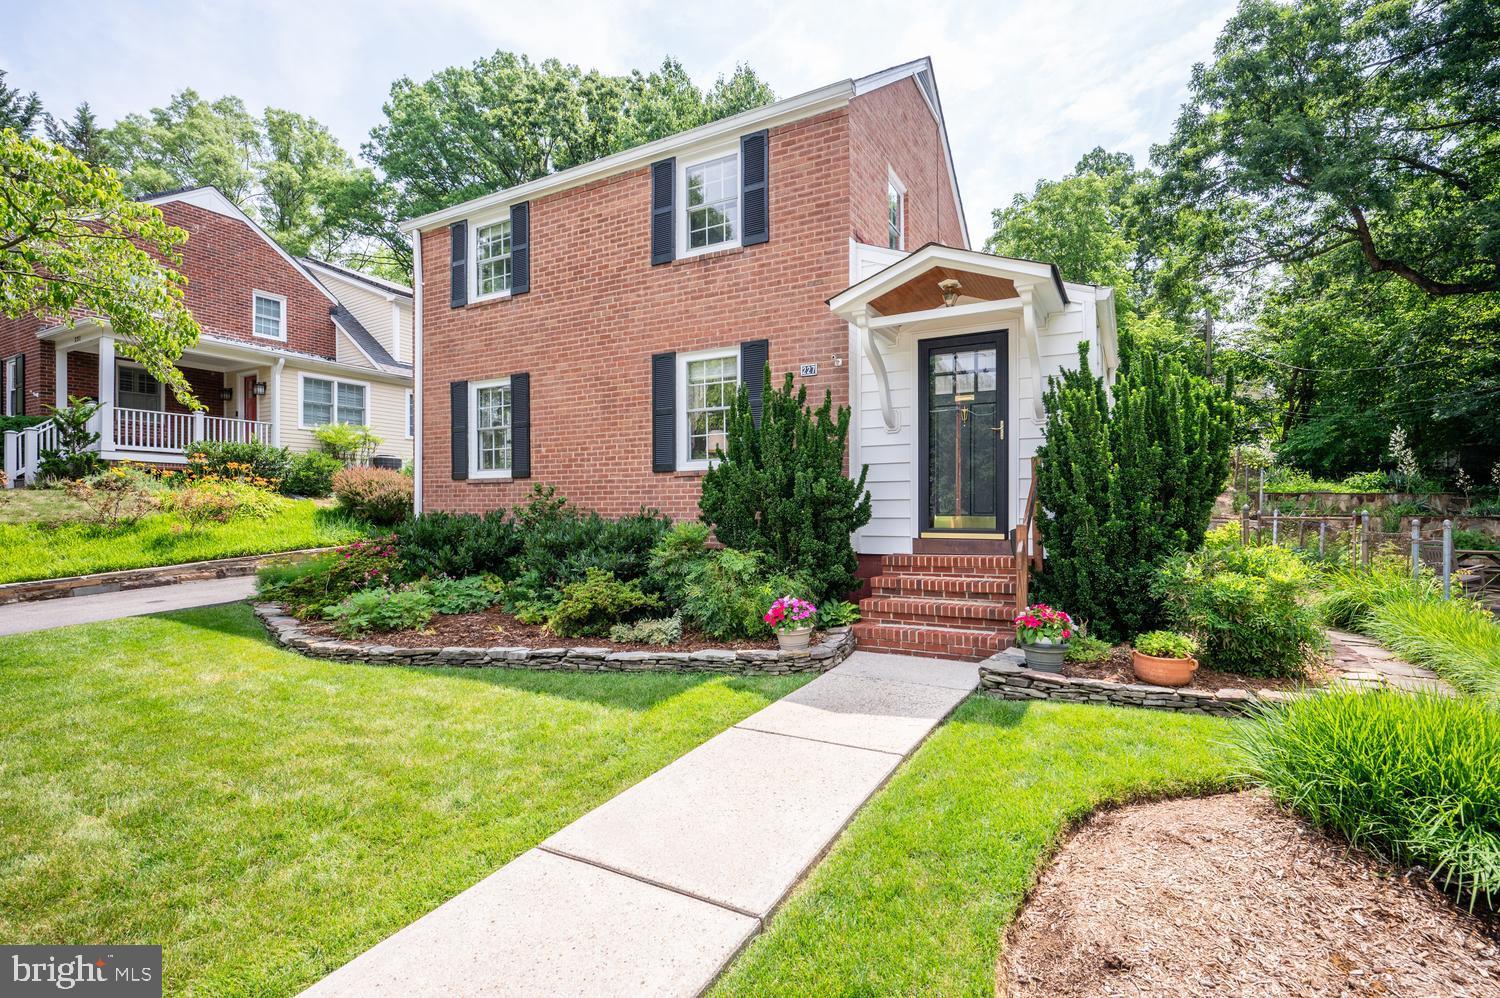
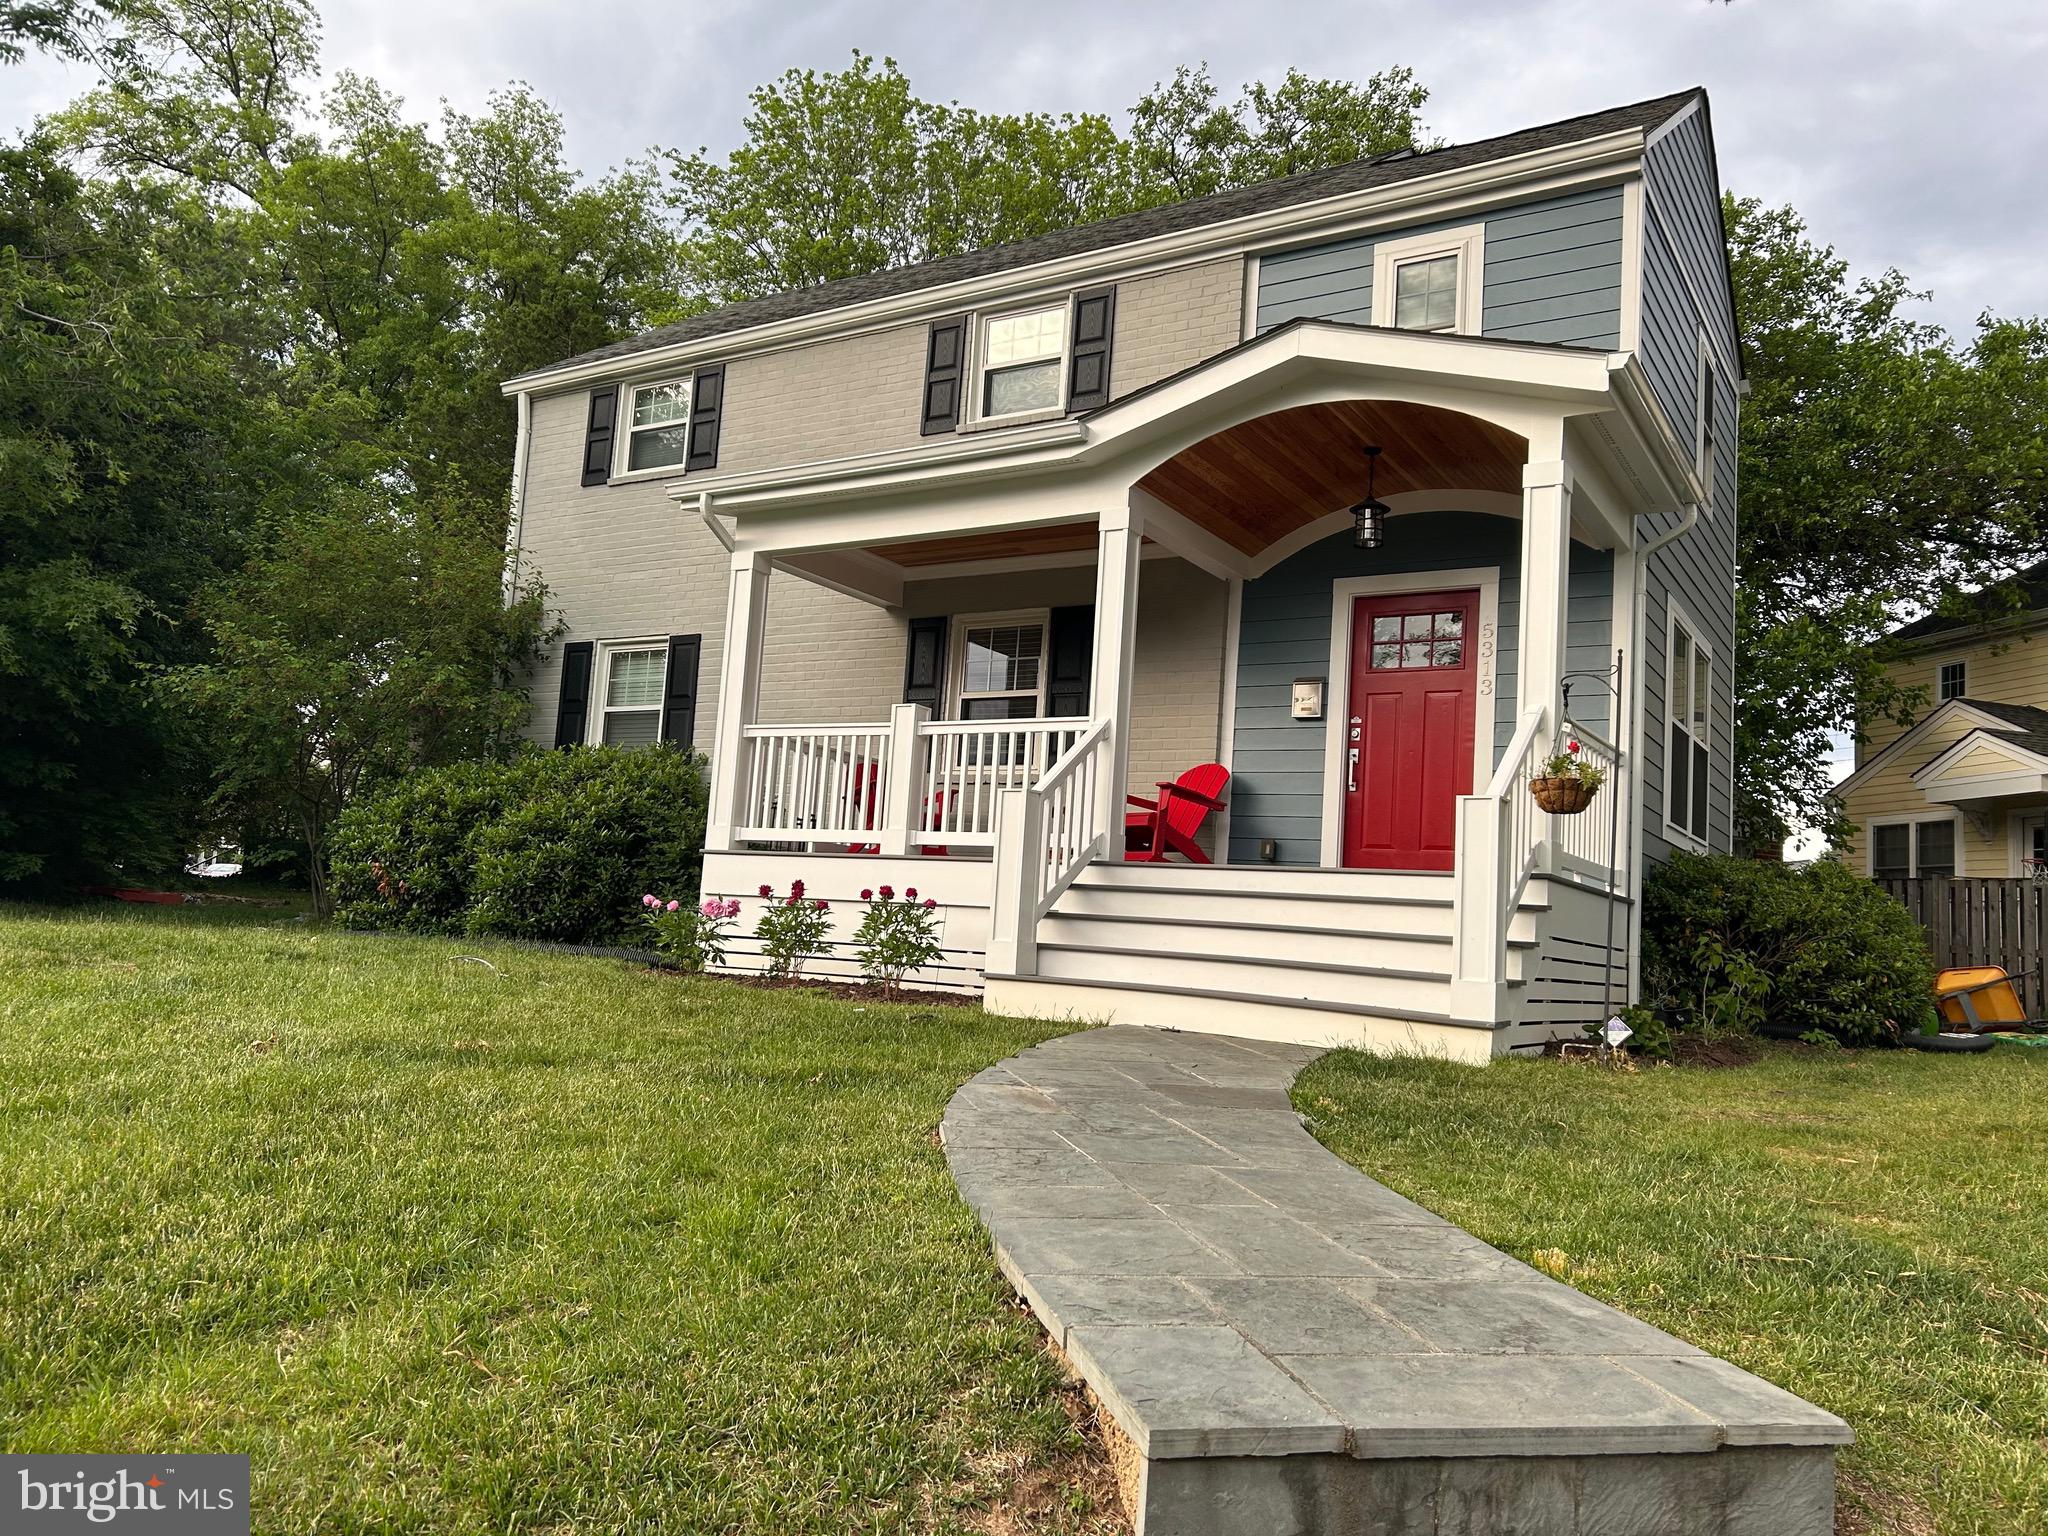
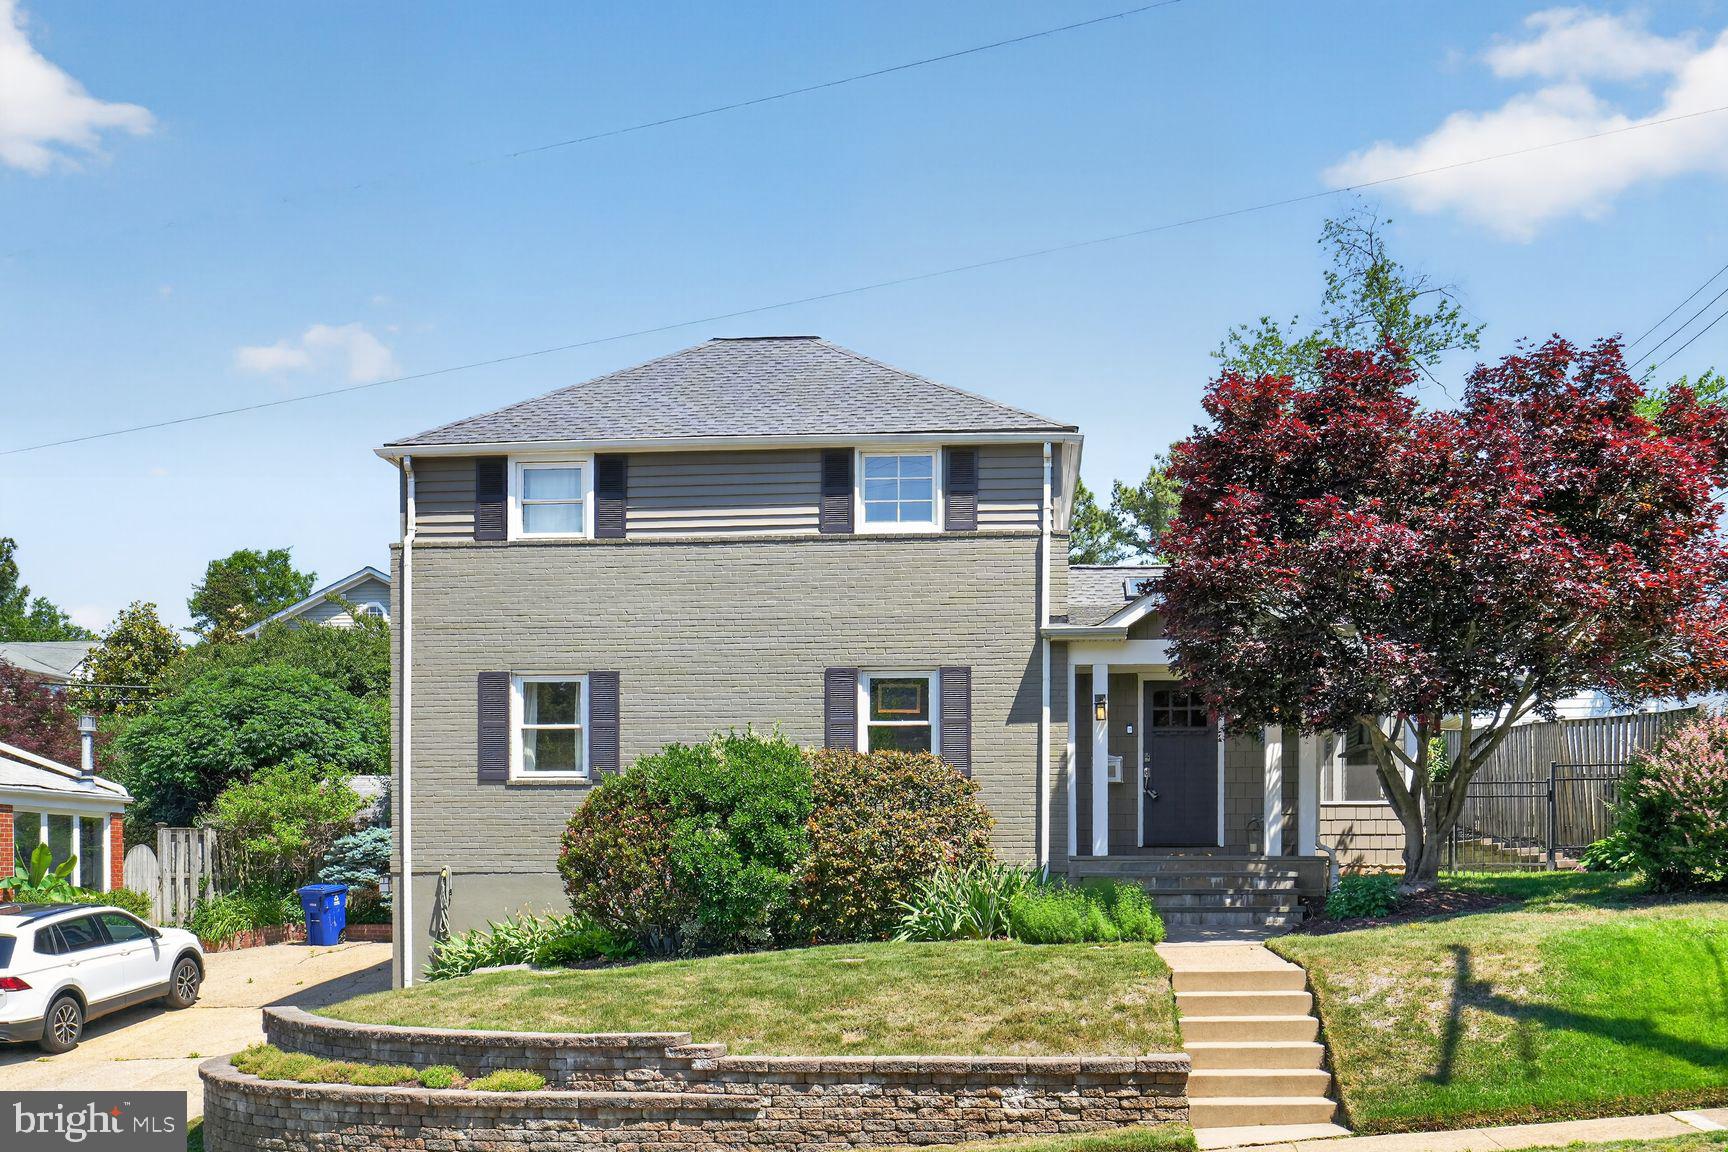
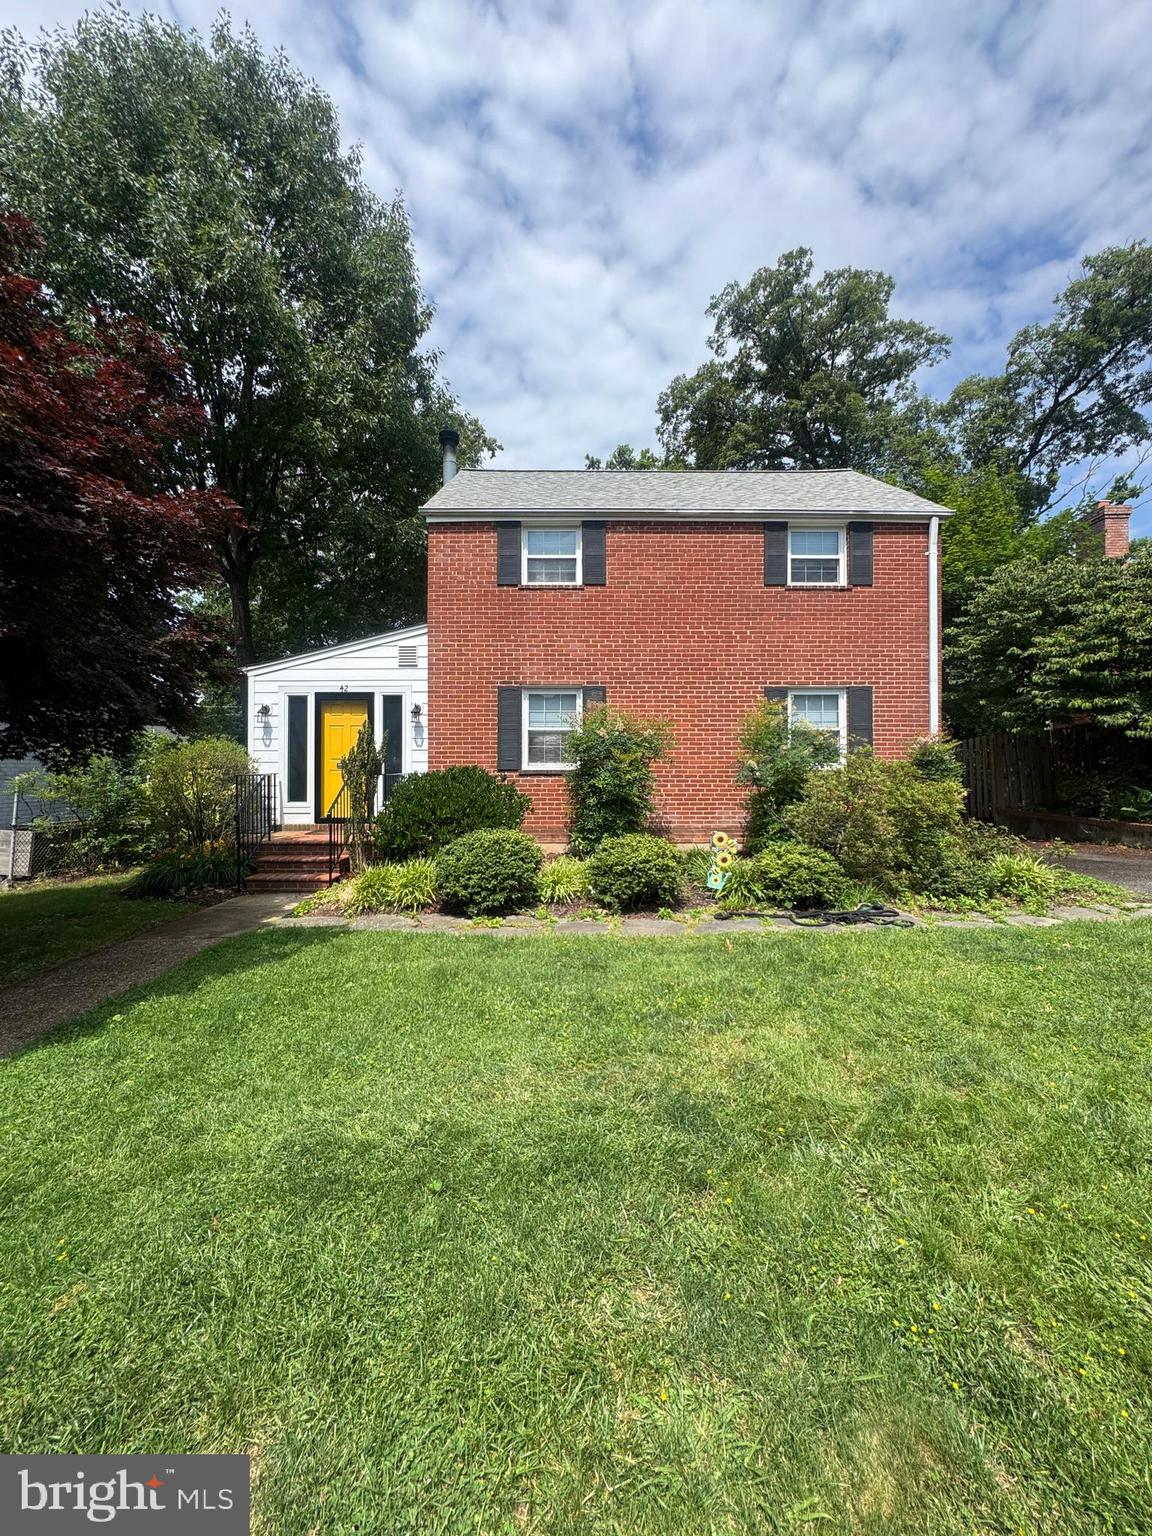
Arlington Forest offers a charming suburban atmosphere with tree-lined streets and a strong sense of community. Residents enjoy easy access to parks, local shops, and vibrant dining options.
The neighborhood's proximity to Washington D.C. makes it ideal for commuters seeking a balance between urban convenience and suburban tranquility. With its well-maintained homes and friendly vibe, Arlington Forest is perfect for families and young professionals alike.
2,108 people live in Arlington Forest, where the median age is 43 and the average individual income is $110,745. Data provided by the U.S. Census Bureau.
Total Population
Median Age
Population Density Population Density This is the number of people per square mile in a neighborhood.
Average individual Income
There's plenty to do around Arlington Forest, including shopping, dining, nightlife, parks, and more. Data provided by Walk Score and Yelp.
Explore popular things to do in the area, including Mimi's Mocha Treats, New York Express Food Cart, and Asia Halal Supermarket.
| Name | Category | Distance | Reviews |
Ratings by
Yelp
|
|---|---|---|---|---|
| Dining | 3.65 miles | 5 reviews | 5/5 stars | |
| Dining · $ | 2.26 miles | 32 reviews | 4.8/5 stars | |
| Dining · $$ | 2.18 miles | 9 reviews | 4.8/5 stars | |
| Active | 2.17 miles | 10 reviews | 5/5 stars | |
| Active | 3.25 miles | 5 reviews | 5/5 stars | |
| Active | 4.12 miles | 8 reviews | 5/5 stars | |
| Active | 0.63 miles | 4 reviews | 5/5 stars | |
| Beauty | 3.65 miles | 5 reviews | 5/5 stars | |
| Beauty | 3.54 miles | 6 reviews | 5/5 stars | |
| Beauty | 1.22 miles | 487 reviews | 4.8/5 stars | |
| Beauty | 3.96 miles | 29 reviews | 4.7/5 stars | |
| Beauty | 2 miles | 28 reviews | 4.6/5 stars | |
|
|
||||
|
|
||||
|
|
||||
|
|
||||
|
|
||||
|
|
Arlington Forest has 733 households, with an average household size of 3. Data provided by the U.S. Census Bureau. Here’s what the people living in Arlington Forest do for work — and how long it takes them to get there. Data provided by the U.S. Census Bureau. 2,108 people call Arlington Forest home. The population density is 8,170 and the largest age group is Data provided by the U.S. Census Bureau.
Total Population
Population Density Population Density This is the number of people per square mile in a neighborhood.
Median Age
Men vs Women
Population by Age Group
0-9 Years
10-17 Years
18-24 Years
25-64 Years
65-74 Years
75+ Years
Education Level
Total Households
Average Household Size
Average individual Income
Households with Children
With Children:
Without Children:
Marital Status
Blue vs White Collar Workers
Blue Collar:
White Collar: